
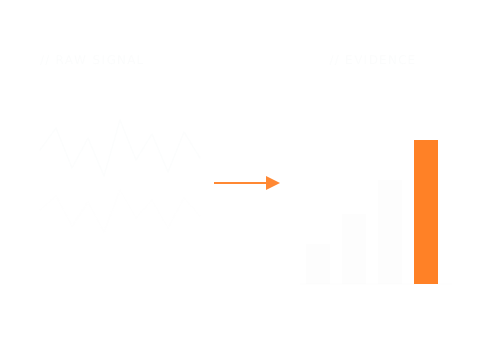
OEE
availability × performance × quality
The single most-watched manufacturing KPI. Composite of three orthogonal failure modes.
// 02 · WHAT WE DO
The framework, the platform, and the path from your operation today to a defensible operating picture.
// 01 · FRAMEWORK
Every operation we touch runs on the same model. Raw signals arrive at the primary tier. We compute KPIs at the secondary tier. We surface decisions at the tertiary tier. Each tier feeds the next, and each is observable, auditable, and replaceable on its own.
EVERY DEPLOYMENT BUILDS THIS SPINE BEFORE BUILDING ANYTHING ELSE
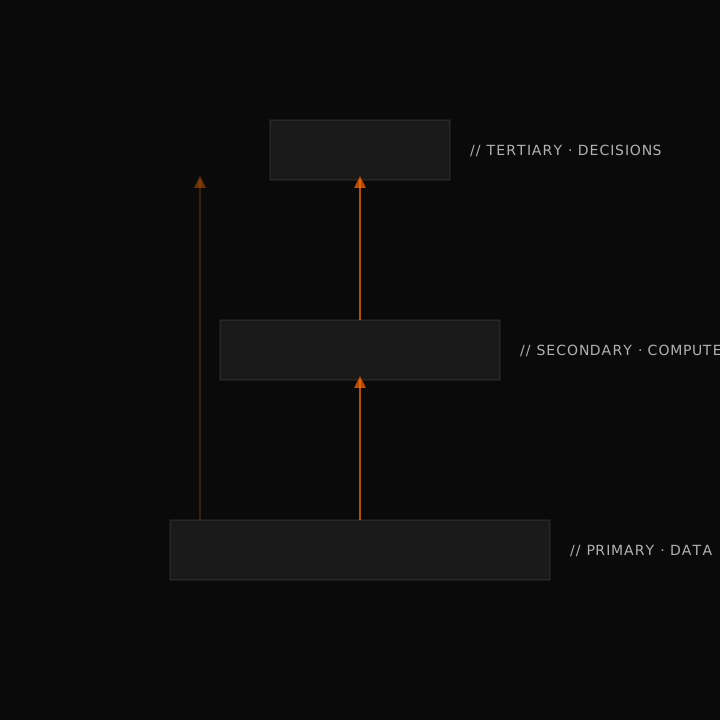
// 02 · PRIMARY · WHERE THE SIGNAL COMES FROM
The primary tier is the data layer - every sensor, controller, system, file, and API that has something to say about your operation. It comes from three places: data you already hold, systems we deploy, and instrumentation we install where there is none yet.
If your stack is already producing data, we integrate it. No rip-and-replace. The data keeps living where it lives; we add the connections and the context.
Where you don't yet have a class of system in place, we deploy one on Quoriam's platform - integrated to the rest of your stack from day one.
When the data isn't being captured yet, we install the hardware to start measuring. Most operational intelligence platforms can't do this. We can.
// 03 · SECONDARY · WHAT WE COMPUTE
The secondary tier turns raw signals into the metrics your operation is actually run on. Every KPI is observable end-to-end: its formula, its inputs, its refresh cadence, its target threshold, and its history. No black-box scores.
availability × performance × quality
The single most-watched manufacturing KPI. Composite of three orthogonal failure modes.
active_hours / available_hours
For mixed fleets - vehicles, equipment, mobile assets. Idle time is rarely productive.
total_uptime / failure_count
Reliability metric. Trended over time to surface degrading assets.
Σ repair_durations / repair_count
How fast the maintenance function actually closes failures.
completed_PMs / scheduled_PMs
Are scheduled maintenances actually happening on time?
reactive_WO / total_WO
How much of your maintenance is firefighting vs planned.
acquisition + (operating + maintenance) × lifecycle
Capex-grade lifecycle costing for asset-level decisions.
// 04 · TERTIARY · DECISIONS YOU CAN DEFEND
The tertiary tier is where the platform meets the operator. Not raw data, not just KPIs - the live state of the operation, the assets at risk, and the decisions pending. Every element traces back to its source signal, so every decision can be defended at audit.
EVERY ELEMENT ON THIS SCREEN IS AUDITABLE TO ITS SOURCE SIGNAL
// 05 · PRODUCTS · BUILT ON THE SPINE
Quoriam isn't one black box - it's four focused products that share a spine, a design language, and your data. Run them on their own or together.
// each one ships today
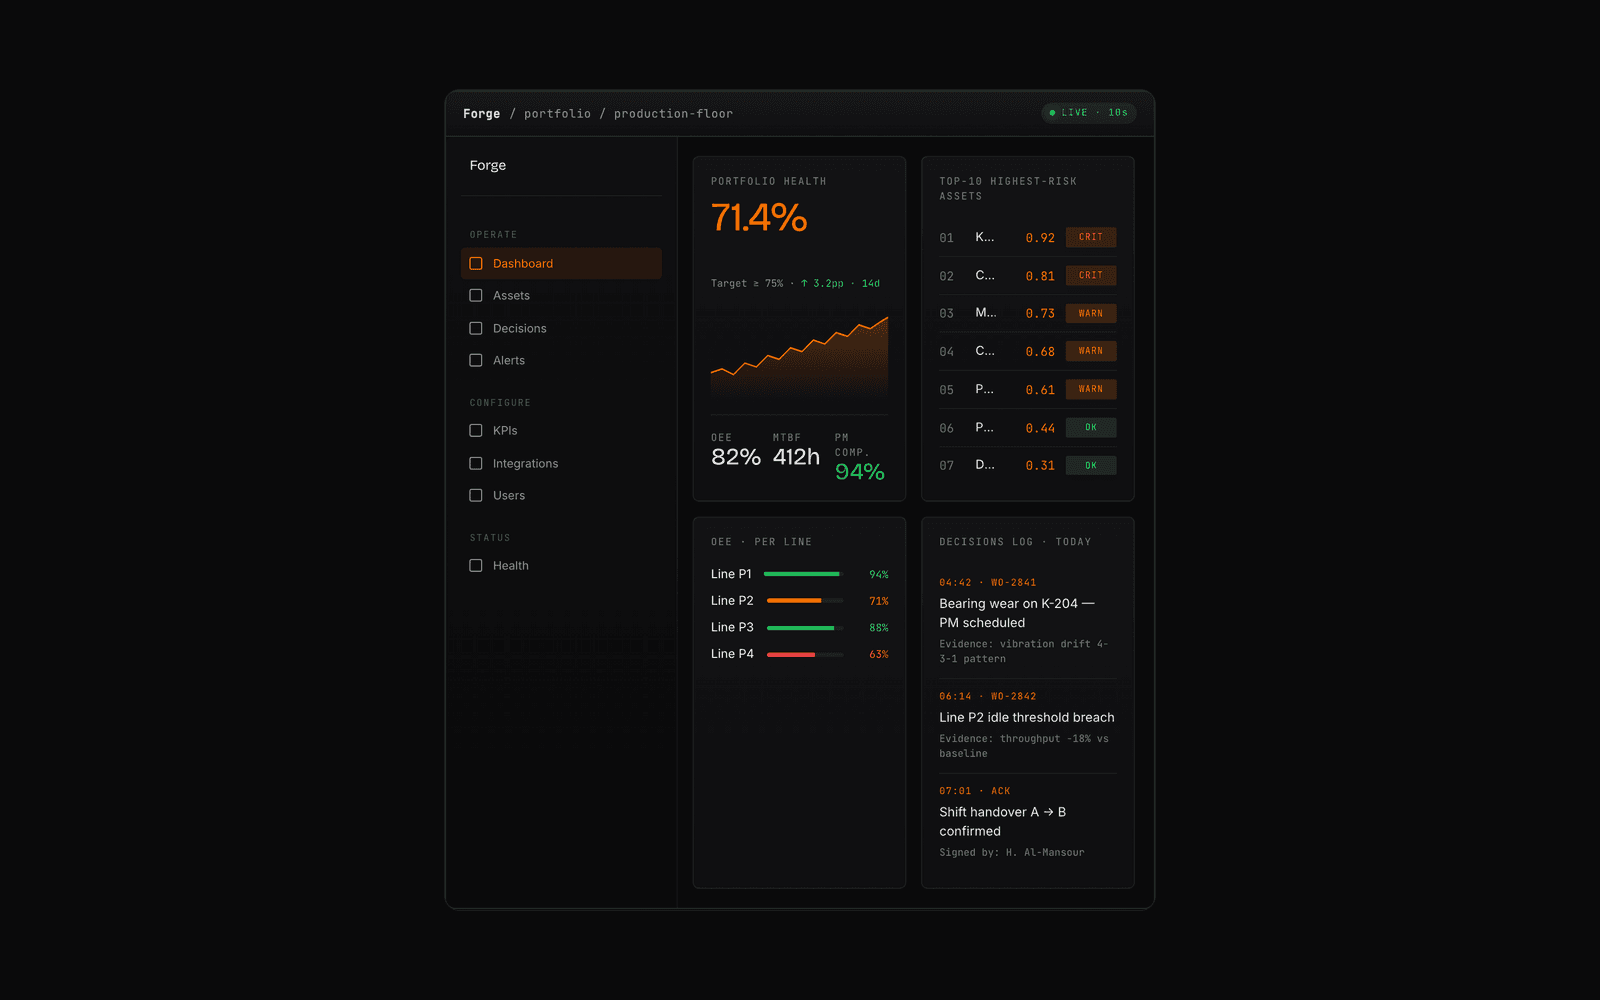
Production that explains itself.
Forge is the connected production platform for manufacturers and factory floors. It turns live plant signals - PLCs, SCADA, historians, MES - into a real-time picture of what every line is doing right now, and why. When output dips or a machine stops, Forge already has the reason attached.
FOR Manufacturers and factory-floor operations teams who want output, OEE, and downtime on one live screen.
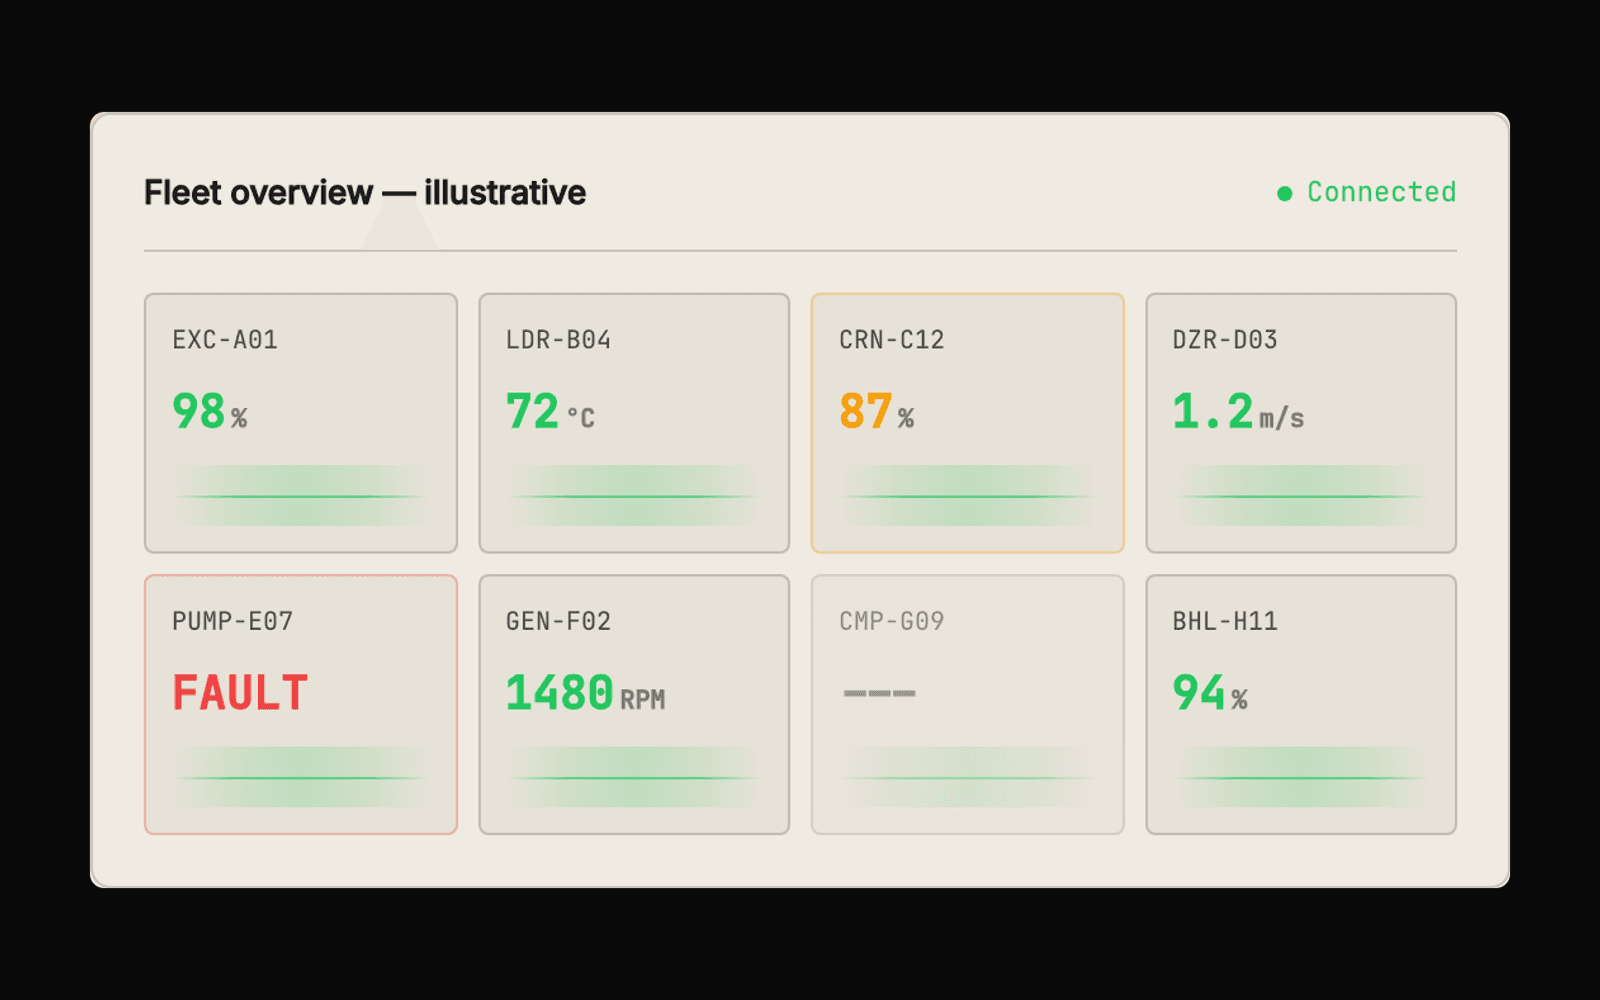
Buildings and assets that report their own health.
Bedrock is industrial asset monitoring and predictive maintenance. It streams from sensor to screen in under 500 milliseconds, watches for the patterns that precede failure, and turns an anomaly into a work order before the asset goes down. For sites where unplanned downtime is the expensive problem.
FOR Asset-heavy operations - construction, heavy industry, facilities - that can't afford surprise failures.
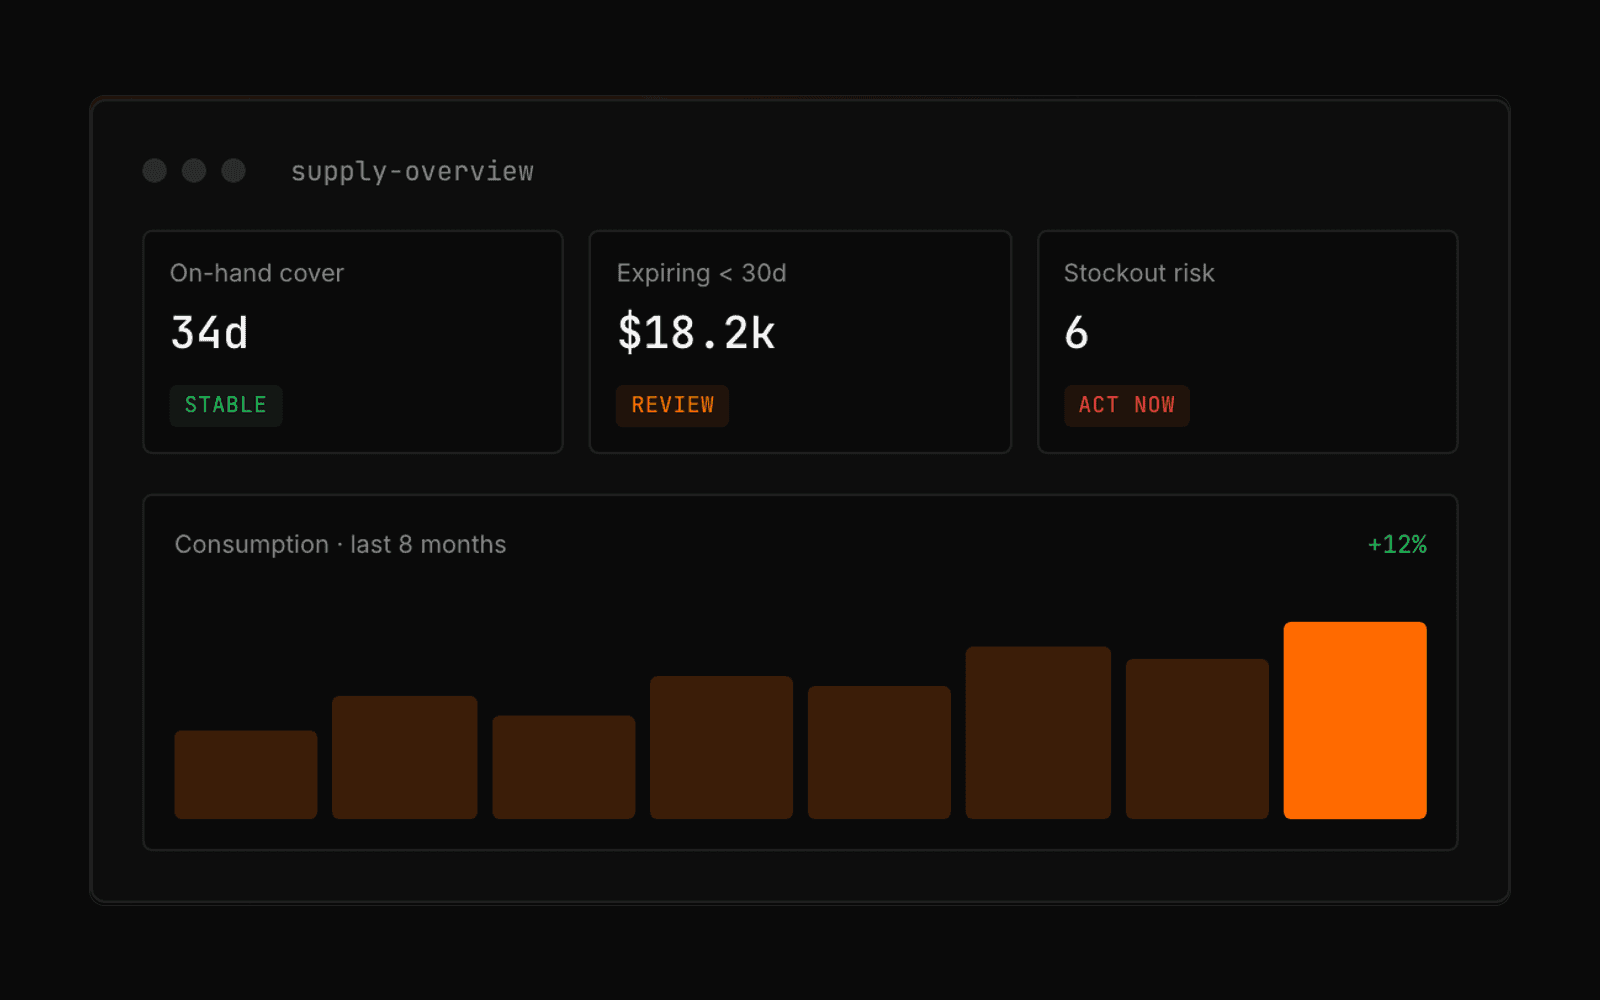
Procurement and inventory you can see around corners.
SupplyChainOS is procurement and inventory analytics for asset-heavy operations. It predicts stockouts before they bite, tracks budget against actual spend, and flags the stock that's about to expire or go obsolete - so capital isn't sitting on a shelf or missing when you need it.
FOR Procurement and supply-ops teams in asset-heavy operations managing critical spares and inventory.
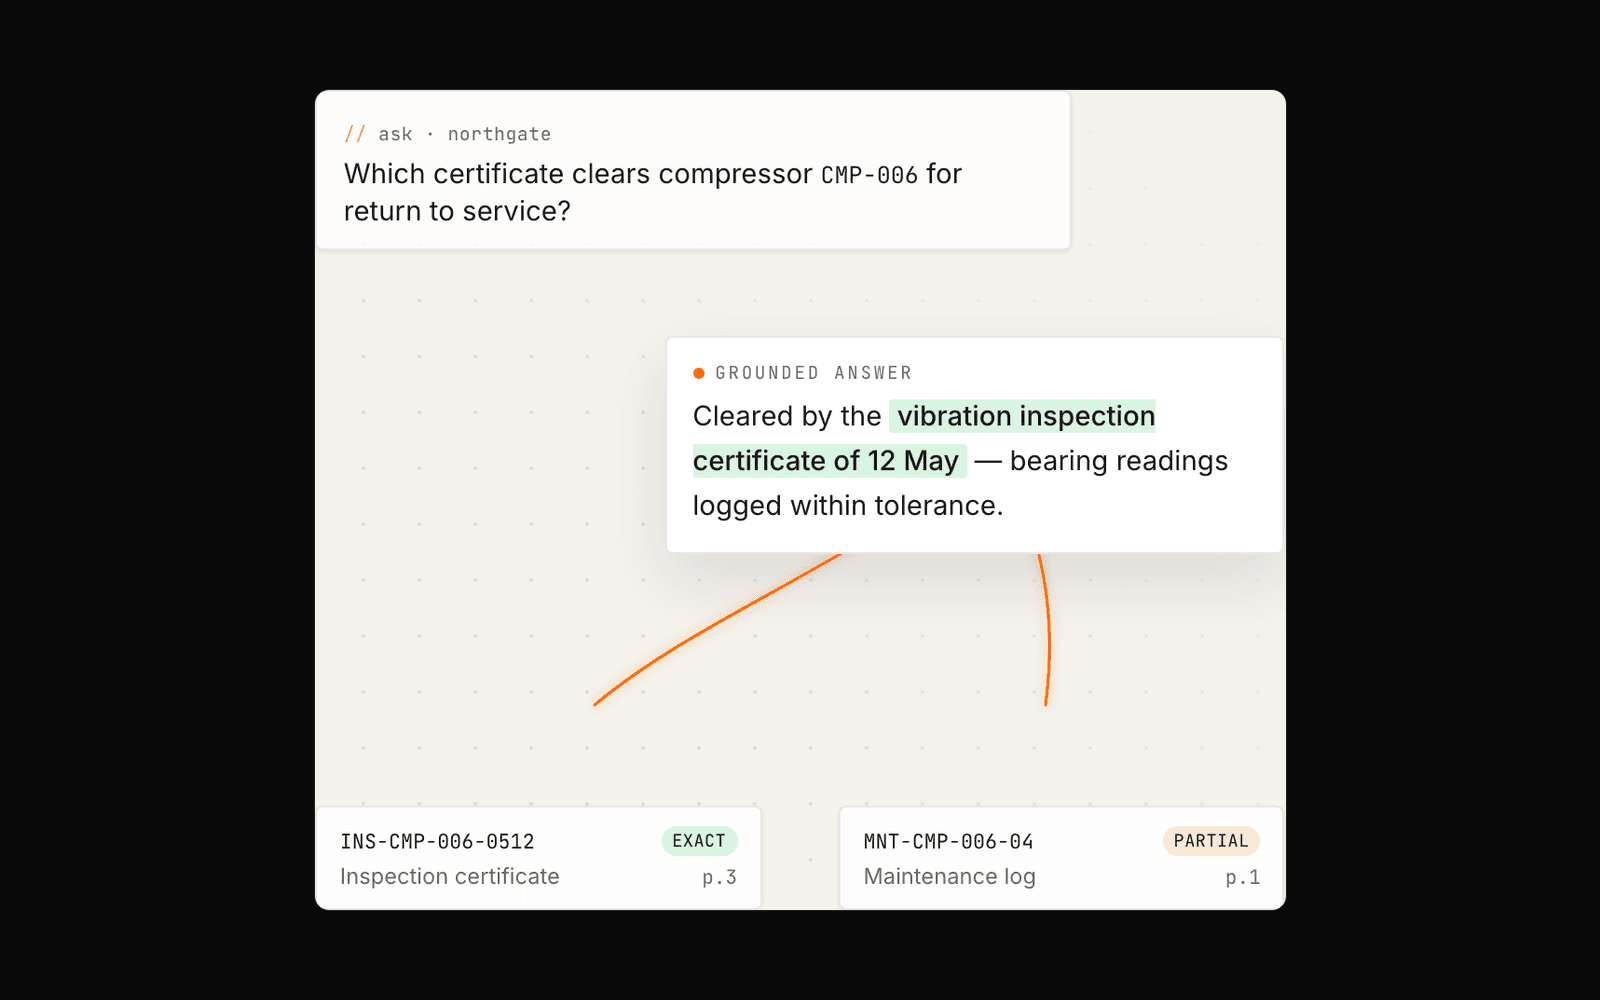
Answers from your documents - with the citation attached.
DocIQ is local-first document intelligence. It runs OCR and extraction over your controlled document collections, then answers questions with cited retrieval - every answer points back to the exact source page. Built for environments where documents are sensitive and the answer has to be defensible.
FOR Regulated and controlled-document environments - compliance, quality, and audit teams.
Don't know which one you need? Start with a free assessment - we'll tell you which products fit your operation.
Book a free assessment// 06 · INTEGRATIONS
Quoriam ingests from every layer of your operational stack - from the sensor on the wall to the ERP on the server - and installs the instrumentation where none exists yet.
SENSORS & INSTRUMENTS
vibration · temperature · pressure · flow · level · occupancy
CONTROLLERS & PLCs
Siemens · Rockwell · Schneider · Mitsubishi · Omron · ABB
INDUSTRIAL PROTOCOLS
OPC UA · Modbus · BACnet · MQTT · Profinet · EtherNet/IP
ENTERPRISE SYSTEMS
SAP · Oracle · Microsoft Dynamics · Maximo · Salesforce
FILES & APIs
CSV · Excel · JSON · XML · REST · SOAP · webhooks
CLOUD PLATFORMS
AWS IoT · Azure IoT · Google Cloud · MQTT brokers
CAN'T FIND YOURS · WE'LL BUILD THE INTEGRATION · OR INSTALL THE INSTRUMENTATION IF NONE EXISTS YET
// 07 · DEPLOYMENT
Most deployments reach a live operating picture within 12 weeks.
WEEK 0
We map your data sources, your existing systems, your missing instrumentation, and your priority KPIs. Output: a deployment plan naming every integration, deployment, and installation.
WEEK 2
Quoriam platform stood up in your cloud, with KSA and regional hosting available. First integrations live. Identity resolution and access roles configured.
WEEK 6
Hardware installed where needed. New operational systems - predictive maintenance, OEE, work orders - deployed on the platform. First KPIs computing live.
WEEK 12
Tertiary-tier dashboards live for operations and executive views. Maintenance, alerts, and decisions logged through the platform. Then continuous optimisation.
// 08 · SECURITY
Operational data is sensitive. Quoriam is built for regulated environments and procurement-grade due diligence. We don't sell access to your data, we don't aggregate it across customers, and we don't store anything in a jurisdiction you haven't approved.
BOTH PATHS LEAD TO THE SAME PLACE · A REAL CONVERSATION ABOUT YOUR OPERATION